Currencies
Bitcoin Fear & Greed Index Points to a BTC Return to Sub-$20,000
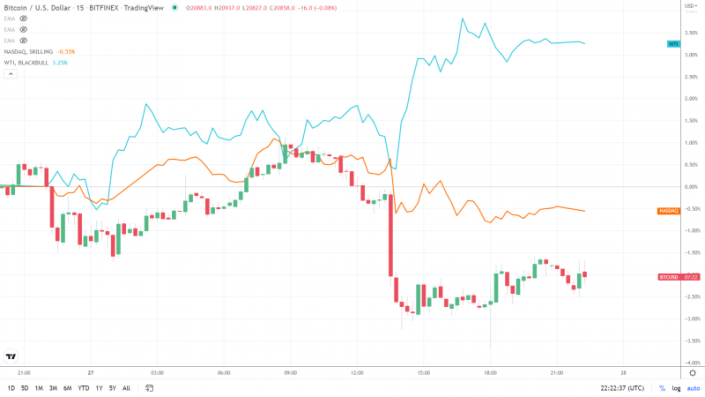
- It was another bearish Monday session, with bitcoin (BTC) falling by 1.49% to end the day at $20,718.
- Bitcoin and the broader crypto market tracked the NASDAQ 100 into the red, with the equity markets seeing a choppy start to the week.
- Technical indicators are bearish, with bitcoin below the 50-day EMA.
On Monday, bitcoin (BTC) declined by 1.49%. Following a 2.06% fall on Sunday, bitcoin ended the day at $20,718.
A bullish morning saw bitcoin rise to a high of $21,505 before hitting reverse. Falling short of the First Major Resistance Level at $21,605, bitcoin slid to a low of $20,553.
Bitcoin briefly fell through the First Major Support Level at $20,716 before a partial recovery to $20,718.
Following the NASDAQ 100 effect from last week, we anticipated further influence at the start of the week.
Early in the session, the NASDAQ delivered bitcoin support before a late reversal. Bitcoin tracked the NASDAQ into the red, though the losses were modest.
A jump in crude oil prices tested support for riskier assets. Commodity prices are causing market angst at present. Crude oil prices responded to news updates from the G7. G7 nations promised to introduce fresh sanctions, including a cap on Russian oil prices.
The pickup in crude oil prices reignited fears of persistent inflation that would force to Fed to stand by its mantra of bringing inflation to target at any cost, which weighed on riskier assets.
At the time of writing, the NASDAQ 100 Mini was up 46.75 points.
Bitcoin Fear & Greed Index Signals Another BTC Return to sub-$20,000
This morning, the Fear & Greed Index fell from 12/100 to 10/100.
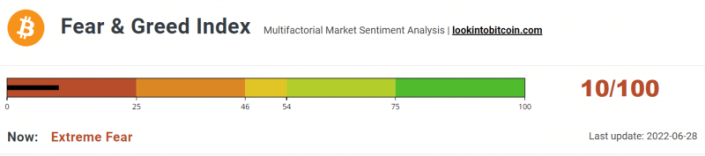
Sitting deep in the “Extreme Fear” zone, the latest Fear & Greed Index pullback brings sub-10/100 and the June 19 low of 6/100 into play. Current levels suggest a bitcoin return to sub-$20,000.
Investors hoping for an Index return to 25/00 and the Fear Zone will need to wait, with recent trends continuing to suggest further bitcoin losses.
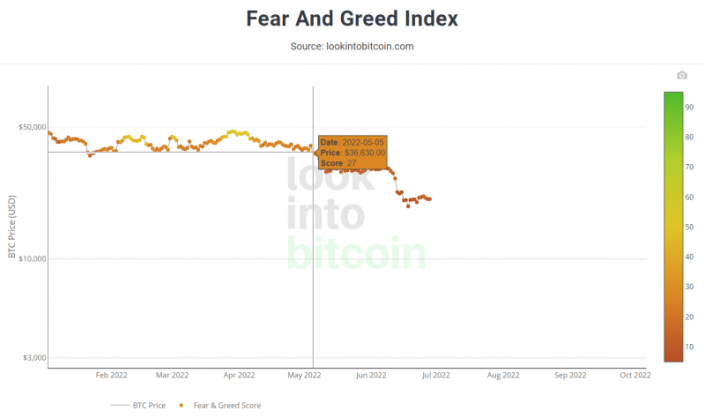
The Index last visited the “Fear Zone” on May 5, when bitcoin stood at $36,630.
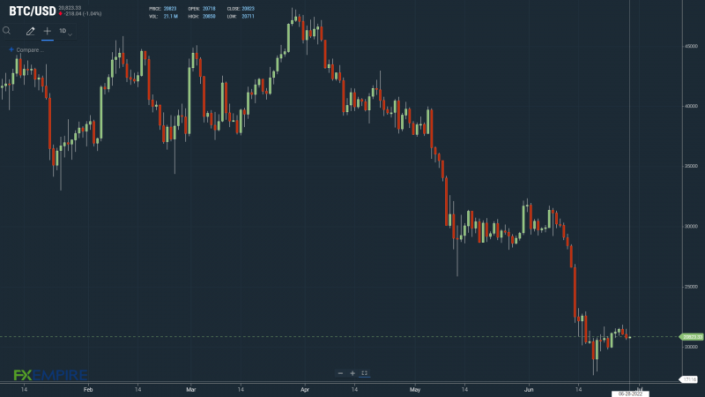
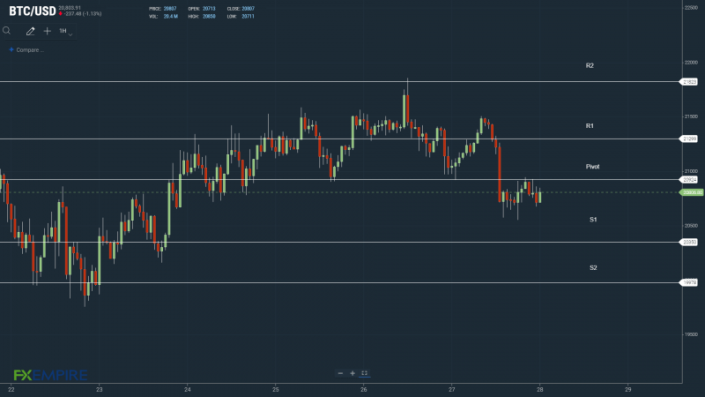
Bitcoin (BTC) Price Action
At the time of writing, BTC was up 0.51% to $20,823.
A mixed start to the day saw bitcoin fall to a low of $20,711 before rising to a high of $20,850.
BTC left the Support and Resistance Levels untested early on.
Technical Indicators
A BTC move through the $20,924 pivot would bring the First Major Resistance Level at $21,299 and the Monday high of $21,505 into play.
BTC would need plenty of support to return to $21,000.
An extended rally would test the Second Major Resistance Level at $21,823 and resistance at $22,500. The Third Major Resistance Level sits at $22,829.
Failure to move through the pivot would bring the First Major Support Level at $20,350 into play. Barring an extended sell-off, bitcoin should avoid sub-$19,500. The Second Major Support Level at $19,978 should limit the downside.
The Third Major Support Level sits at $19,021.
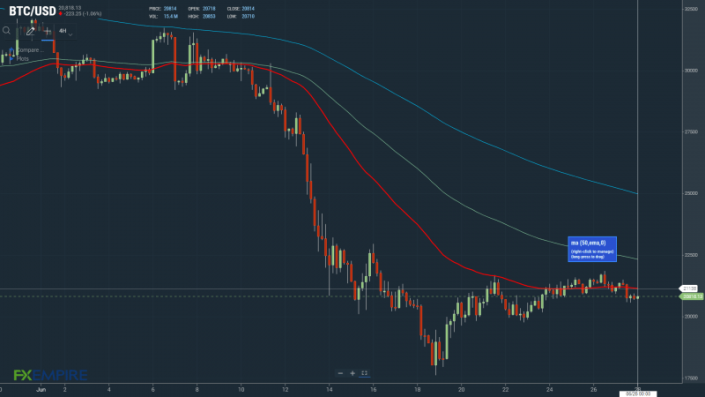
Looking at the EMAs and the 4-hourly candlestick chart (below), it was a bearish signal. This morning, bitcoin sat below the 50-day EMA, currently at $21,138.
The 50-day EMA fell back from the 100-day EMA. The 100-day EMA eased back from the 100-day EMA, bitcoin price negative.
A return to $22,000 would bring the 100-day EMA, currently at $22,338, and resistance at $22,500 in play.
However, failure to move through the 50-day EMA would bring the Major Support Levels into play.
This article was originally posted on FX Empire