Cryptocurrencies
Bitcoin (BTC) Trending Amidst Broad-Based Crypto Sell-Off
On Tuesday, Bitcoin (BTC) fell by 2.38%. Reversing a 0.42% gain from Monday, BTC ended the day at $45,502.
A bullish morning session saw Bitcoin strike a mid-day high of $47,188 before hitting reverse. The reversal saw Bitcoin slide to a final hour intraday low of $45,383.
Bitcoin fall through the day’s First Major Support Level at $45,532.
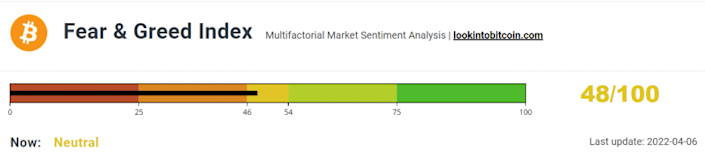
Bitcoin Fear & Greed Index Hits Reverse
A bullish Sunday session saw the Bitcoin Fear & Greed Index move back to 52 before the latest pullback.
The index fell back to 48/100 on Tuesday. Despite the decline, the index remained within the ‘Neutral’ zone.
For a Bitcoin return to $50,000, the index would need to return to the ‘Greed’ zone.
On Tuesday, hawkish FOMC member chatter weighed on riskier assets ahead of today’s FOMC meeting minutes.
FOMC member Brainard talked of reducing the balance sheet at a faster pace to curb inflation.
The NASDAQ 100 slid by 2.26% in response to the hawkish chatter.
Bitcoin Price Action
At the time of writing, Bitcoin was down by 1.06% to $45,021. A bearish start to the day saw Bitcoin fall to an early morning low of $44,465.
Bitcoin fell through the day’s First Major Support Level at $44,861 before returning to $45,000 levels.
Technical Indicators
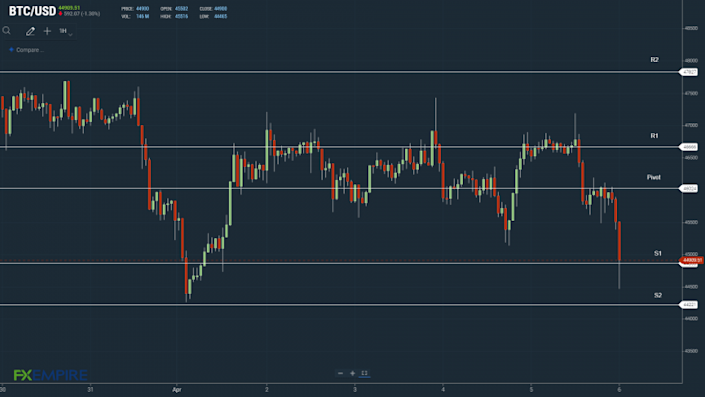
Bitcoin will need to move through the day’s $46,024 pivot to make a run on the First Major Resistance Level at $46,666. Bitcoin would need broader market support to break out from $46,500 levels.
In the event of another extended rally, Bitcoin could test the Second Major Resistance Level at $47,827 and resistance at $48,000. The Third Major Resistance Level sits at $49,634.
Failure to move through the pivot would bring the First Major Support Level at $44,861 back into play. Barring an extended sell-off, Bitcoin should avoid sub-$44,000. The Second Major Support Level at $44,219 should limit the downside.
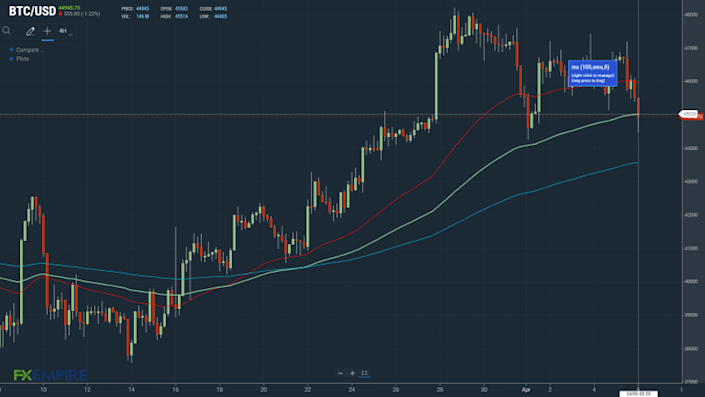
Looking at the EMAs and the 4-hourly candlestick chart (below), it is a bullish signal. Bitcoin continues to sit at the 100-day EMA, currently at $45,026. This morning, BTC narrowed to the 100-day EMA, testing support. The 100-day EMA narrowed to the 200-day EMA, which was BTC negative.
A move back through the 50-day EMA would support a return to $48,000 levels.
This article was originally posted on FX Empire